Showing posts with label Data Visualization. Show all posts

Saturday, 27 May 2017

Tableau Desktop 10 Certification Preparation

In the previous blog, I talked about the importance of Data Visualization , and how organizations are seeking for those who are skilled in Data analytics and data visualization. There are many benefits to be certified in this area. Check out this article. ( 5 Reasons to Learn Tableau – A Deep Dive into Tableau Career Opportunities!). So, Are you in the process of preparing for tableau certification? Well, this is an excellent decision that you have made in your career life because is the simplest application that helps to see and understand the data, and you don’t need to do any coding. Here are more benefits to check out:


Image Ref: Technology

In this blog, I will share with you some of the useful resources that I think it helps you to understand the main concepts to pass the exam. But first, let me provide you with basic information about exam structures 

Tableau Desktop 9 Qualified Associate

  • Time Limit: 2 hours (Please plan for extra time for online exam setup) 
  • Passing Score: 75% 
  • Content Version: 10.0 
  • Number of Questions: 36 Scoring: 100 points total; point value varies per question type with hands-on worth more
  • Question Format: Multiple choices, multiple responses, true/false, hands-on (Tableau Desktop 10.0 will be provided)
  • Language(s) Offered: English, Japanese, Simplified Chinese, German, French, Brazilian Portuguese, European Spanish 
  • Delivery Platform: Virtual Machine containing Tableau Desktop 10.0

    This a Youtube Channel provides tutorials and tips on how to use tableau, best practices in creating a reports, dashboards and more.
    In this website, you will get free Sample Workbooks and short videos.
    you can use the videos and material provided by Tableau on their website as it is really good and you need to register with them to be able to use it. Practicing the tool while going thru the videos is really helpful in building hands on knowledge.
    This PDF has the list of topics required for certification with a hyperlink on each topic to the tutorials/videos/knowledge base.
    A useful blog that explains Tableau main concepts and how to apply them correctly.

    Monday, 24 April 2017

    The Essence of Data Visualization (Conclusion)

    As I mentioned previously that data visualization is a combination of art and number. When it combined together, it creates a special language that helps us communicate information better, and the attract our eyes and mind to discover patterns, trends, and correlations in our businesses that might otherwise go undetected.

    In Ghofran Batterjee’s blog mentioned that “Due to the easy accessible of data analytics that is assorted and represented impactful visually and had a better efficiency in representing the information, decision makers can identify new patterns because, without a doubt, it is like taking a further step by examining the graph or chart for more details and information and engaging the message quickly.” I totally agree with her on this point. Indeed, focusing on the key challenges analysts face trying to communicate complex information, and how visual communication can help.


    But, What Are Some of The Best Data Visualization Tools?


    I totally agree with her on this point. Indeed, focusing on the key challenges analysts face trying to communicate co


    Many digital marketers asking the same question about which is the best available tools for data visualization that will help them to translate the collected data into meaningful information.
    Here are the most popular tools for data visualization:
    1. SAS Visual Analytics
      • This tool allows you to create interactive reporting in a visually appealing format and dashboards.
      • Users can enhance the analytic power of their data, explore new data sources, investigate them, and create visualizations to uncover relevant patterns.
      • Enables users to apply the power of SAS analytics to massive amounts of data.
      • Empowers users to visually explore data, based on any variety of measures, at amazingly fast speeds.
    1. Tableau  Norah's Marketing Analytics Blog gives an excellent explanation for Tableau
      • Easy to integrate
      • Visually-appealing reports that are easy to understand
      • Easy to use
      • Create visualizations for a large amount of data without crashing


    Sunday, 23 April 2017

    The Essence of Data Visualization

    In the last blog, I gave an overview about data visualization. Today, we will dive more into the importance of data visualization to ensure an organization’s success.
    A little fact about the human brain process, “the human brain processes images 60,000 times faster than text, and 90 percent of information transmitted to the brain is visual. “(1)
    Since we are visual by nature, organizations must leverage data visualization and unlock their true potential to meet mission and business goals.
    What is the Importance of Data Visualization?
    Regardless of industry or size, all types of businesses are using data visualization to make highly informed decisions quickly. Organizational leaders need to be able to access and interpret data in real-time. Moreover, to identify new business opportunities ahead of the market, business leaders require the ability to access, evaluate, comprehend, and act on data faster and more effectively than ever before.
    The importance of using data visualization essences around comprehending information more quickly. By using graphical representations, businesses can see large amounts of data in clear, cohesive ways and draw conclusions from that information. As a result, businesses can address problems or answer questions in a timelier manner. Another point is that revealing emerging trends in the market. This can give businesses an edge over the competition. How to incorporate data visualization with storytelling?

    Storytelling is the best method that can be used to translate numbers into meaningful facts that organizations could utilize to ensure success. As digital marketers, creating a remarkable story to the audience and definitely use data visualization to perfect our narrative. We are responsible for bridging the gaps between the data and those who need to learn something from it. Today, data is powerful, but with a good story, it will be unforgettable.
    “data-driven stories attract the kind of social media attention that publishers dream about: fresh data and infographics spread across Twitter, Facebook and other social channels precisely because they are able to tell a story in a concise, compelling and visually appealing way.”(2)
    Indeed, using data to tell a story to touch the audience emotions and keeps them coming back for more. Using data visualization as your storytelling method gives you the power to translate complex ideas and vast of information into remarkable digital experiences.
    Characteristics of effective graphical displays(3)
    Excellence Graphical displays should:
    • Show the data.
    • Induce the viewer to think about the substance rather than about methodology, graphic design, the technology of graphic production or something else.
    • Avoid distorting what the data has to say.
    • Present many numbers in a small space.
    • Make large data sets coherent.
    • Encourage the eye to compare different pieces of data.
    • Reveal the data at several levels of detail, from a broad overview to the fine structure.
    • Serve a reasonably clear purpose: description, exploration, tabulation or decoration.
    • Be closely integrated with the statistical and verbal descriptions of a data set.


    Examples of data visualization:

    what 2016 would look like if just women voted?

    The Web and social analytics dashboard by Kilpfolio
    To learn more about the different types of charts and when to use them please check out Vita Savenko Blog.
    In the next blog, I will provide a comparison between the best data visualization tools

    Saturday, 22 April 2017

    The Essence of Data Visualization (Overview)

    Data visualization is a process of converting unorganized data to a visual context which helps people to understand patterns, trends, and correlations of the collected data. The best practice, before starting data visualization, data must be gathered, organized, interpreted and then analyzed data to provide any meaningful value.

    The main goal of data visualization is to communicate information clearly and efficiently via statistical graphics, plots and information graphics. Effective and clear visualization helps users analyze and reason about data and evidence. It makes complex data more accessible, understandable and usable.

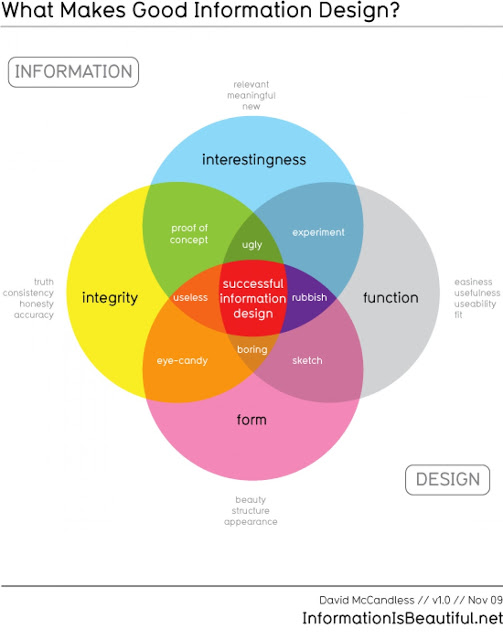
    “To convey ideas effectively, both aesthetic form and functionality need to go hand in hand, providing insights into a rather sparse and complex data set by communicating its key-aspects in a more intuitive way.”(1)

    Fernanda Viegas and Martin M. Wattenberg have suggested that

    "an ideal visualization should not only communicate clearly but stimulate viewer engagement and attention."

    I have come across a very interesting Ted Talk which explains The beauty of data visualization for David McCandless. In his ted talk, He explains how information design can help us get through information glut on the Web and how simple charts can show patterns that we would never have seen otherwise.

    Watch his TED Talk: The Beauty of Data Visualization


    In the next post, I will explain the importance of data visualization, data visualization characteristics, and more.